Tuesday, 26 January 2016

When some experiments are a mess


Sometimes in Science the data you expect from your experiments do not appear. This is the reason why Biology, or Microbiology in this case, is an experimental Science. As you already know last experiments should have indicated a putative mutation frequency affected by the uv treatment. However, we have only data from the plates incubated at Paula’s Home (Fig. 1; 3I plates). The plates incubated in the Lab (3G plates) are a real mess!


Figure 1: images of the plates with identical dilutions of 3I (Paula’splates) and 3G (Labplates)isolates. Above plates indicating total bacteria (TY plates). Below plates indicating mutants in SacB gene (Sacarose plates). In 3G plates the bacterial spread was not properly done. Plates were not dried before to perform incubations.It is difficult to count colonies and to be sure of the dilutions performed.

Which is this difference of this result with the previous one (see last entries)?
 As I mention, something (just a Little detail) was wrong. I found out that the plate were humid when I saw one day later after incubation. This humidity is critical to form single colonies (also occur in previous experiments). Does it!!!.
However, in spite we can not yet estimate the mutant frequency. We can deduce that the experiments are, in principle,well performed. Uv treatments looks to have in effect on bacteria, and the dilutions calculated are probably right in order to get the accurate conclussions of our work.
Come onstudents!!
We have to planify the next experiments in order to avoid this error. Plates must be dry by standing opened for a while (3-5 min) before to close with parafilm and put in the incubators.
Again, next session is awaiting us!!
That is Science!! Be patients and consistents.

Francisco Martínez-Abarca
Estación Experimental del Zaidín. CSIC.
Granada 

Tuesday, 19 January 2016

The beginning of our experimental work end

Hi All:
As usual, how hard was our last session! Wasn´t it!!

Figure 1:Lucia and Mónica starting their bacterial dilution series.

Why was it so hard?
Because…
First of all, we were discussing during almost two hours what we performed until 18th of January of 2016 in our Project: Studying uv effect on bacterial growth… .Since the first experiment: how many bacteria are in a single colony?  To the final one: determine which is our basal mutation frequency.
Second: We discussed what the number of colonies in the plates means. And as a consequence we ‘ve found out what we are doing with
-Dilutions of cultures,
-plating,
-volumes…
And as I mention previously, we are counting bacterial colonies!!!.

 Figure 2: Cristina and Alba counting…

We estimated the división rate of our bacteria at… Paula’s home and Laboratory (28ºC) conditions.
Remember:
2n = Nº of Total bacteria; then, n is… (see your notebooks!!!).
And we also performed the following table:


Table 1: Colonies number to determine the mutation frequency (dilutions 0 and -1 corresponds to number of colonies in Sacarose 5% plates; dilutions -5 and -6 with TY plates).

And confirm we are in agreement with previous results in last PIIISA Project (see here
And Finally we planify our first uv treatment experiment!!!.
Based on literature and what we expected we performed the following experiment:
Two bacteria (3I, series 1-3;  and 3G, series 4-6).
Three uv stress conditions: 0 (no stress), 15 and 30 seconds.
In order to get all the numbering data we decided to make the corresponding dilutions of the following manner:     
a)  For the Control plates (0 uv treatment; series plates 1 and 4). The dilutions were performed in a similar way to previous one.

b) For the 15 and 30 s uv treatment (series 2-3 and 5-6). We estimated that 90-99% of the bacteria will dead. Then the dilutions performed were: 
  

After several rounds of dilutions, spreading (hopefully) without mistakes, we are waiting for our results. We have two different strains (3G and 3I) to have any data. One (3I) it is incubated at Paula’s home

 Fig. 3: OurPaula’s home incubator.

And the second (3G) in the Lab.
Several critical points in our experiment:
1)      Did we make the calculations properly?? (I think so but… who knows?)
2)      Did we make the dilutions properly?? Everybody should peform the pipetting and tubes and plates properly, without any mistake. (We’ll see….).
3)      The most important one: Is it adecuate the uv treatment performed??  This is, neither great, so we kill too many cells, nor small we didn’t see any mutation rate increase.

Girls, Keep alert!!

Next results will define how far we are in our Project.
Come on!!! we are closer to the End

Francisco Martínez-Abarca
Estación Experimental del Zaidín. CSIC.
Granada

Thursday, 14 January 2016

Ready for our next session

Hi  All:
The next session (first session of 2016) is awaiting us. Finally we have data about the uv treatment we are going to made (see previous entries and Figure 1).


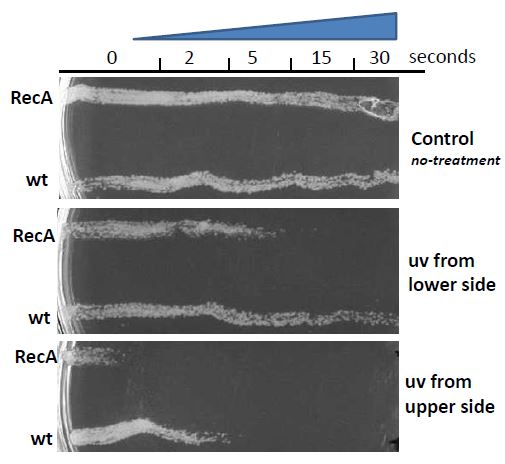
Figure 1: Time course of uv treatment of wt and RecA mutant (uv sensitive) S. meliloti spread on plates. After uv doses (0-30 s) TY rich media plates were incubated for 4 days at 28ºC.


As expert in Microbiology you are able to understand completely this result, aren’t you? 
With this result, we have enough data to determine our uv treatment in order to test our hypothesis. Next session we'll discuss the results of previous experiments (colony counting and estimation of mutation frequency; 17th December entry) and interpretation of this last result. 
Come on!!! Hopefully, we are finishing our experimental research and starting to get and interpret our results.

For next session do not forget:
-Calculators
-Your notebooks
-Remember all we have made until now
And have your minds wide awake!!!

Francisco Martínez-Abarca
Estación Experimental del Zaidín. CSIC.
Granada

Friday, 18 December 2015

Working in Christmas time

A recent paper in Science this year (see here) was also commented in national newspaper http://elpais.com/elpais/2015/02/19/ciencia/1424365384_702791.html 


As experts of our research we can see the links of this important research with our particular research (uv effects on health). It is important to realize all the implications of our research although the methodology, biological system (uv treatments of mouse skin) were different.
On the other hand, our first uv treatment was deleterious (nothing growth on the Paula´s home  plate, neither Lab plate)Now, Paula has at home a new plate with a uv treatment less aggressive - 5 seconds to 0. 
We ‘ll see our results during this week.
Keep in contact via wassap, mail or blog.
Think in our project during holidyas and as usual… 
Again have a nice Christmas holidays

Thursday, 17 December 2015

Calculating our basal mutation frequency

Hi All:
After  8 days (6 days of bacterial cultivation at Paula’s home). We have our first numbering  results. We made plating and we have colonies for counting.

Fig 1: Lab sacharosa plates

Fig2: Lab TY plates

Fig3: Paula’s Sac Plates

Fig 4: Paula’s TY plates

Watching our results it is difficult to interpret a mutation frequency,  isn’t it?
Of course, dilution 0 of Sac plates cannot be counted (we have to discuss what occurs in such plates) but, what about the others?
If you analyze the plates you find out there is a good correlation between lab data and Paula’s home data. We can fill in a table those numbers and estimate the mutation frequency:
Number of colonies Sac Resistant/Number of colonies of total culture.
Again we must remind the dilutions we performed (see previous blog entries)
Students!!! We have as home work this Christmas to estimate the basal mutation frequency of 3G isolate based on Lab plates and Paula’s plates Also see the images of the wassaps!!!. 
Is it 10-4, 10-5, 10-6, 10-7, zero?? 
Please use the blog to explain our results!!!. Compare then with the previous blog. We can assume that our results are reproducible (also we can estimate error margins).

Again have a Nice Christmas Time!!!

Francisco Martínez-Abarca
Departamento de Microbiología y Sistemas Simbióticas.
Estación Experimental del Zaidín. CSIC.

Thursday, 10 December 2015

Determining our basal mutation frequency

Hi All:
After “playing” to be microbiologist of previous sessions, yesterday we began to deep in our project dealing with “the determination of mutation frequency of a bacteria under ultraviolet (uv) pressure”.
First of all, remind all the things we performed yesterday.We have to take them in mind for our next session on 18th of January. Please do not forget them during the Christmas time.
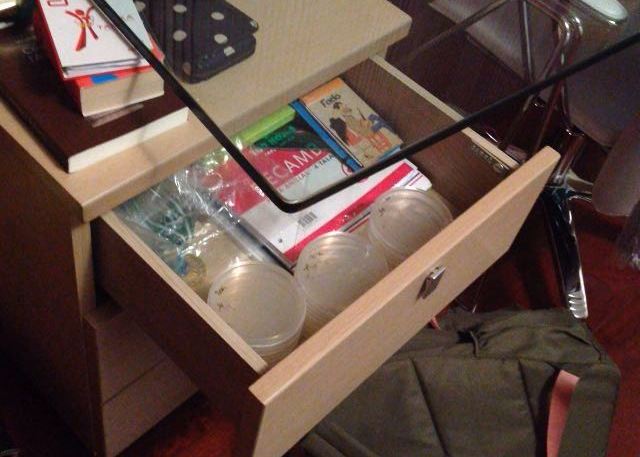
1st) From previous bacterial experiments we determine that the best house to obtain bacterial growth data is the Paula’s home. In order to compare future experiments and data we decided to use as growth chamber the drawer of her room. We need a picture how all these plates are incubated (see previous blog as example: http://dondemutanlosgenes.blogspot.com.es/2015_01_01_archive.html).
2nd) Single colonies of the bacteria 3I and 3G were inoculated on Monday (two days before; I made it!!) in order to determine how many bacteria present a mutation in the SacB gene (the basal mutation frequency). However, only 3G grew. In science, sometimes occur“these things”. We decided to collect data of three independent colonies (1-3) of the bacteria 3G. To perform this, we:
 a)      First, measure the OD600 of the culture and consider that 0.5 corresponds approximately to 108bact/ml.
 

1- Cristina collecting the OD data which are:
1: 0.656
2: 0.377
3: 0.620
b)      We assume that all cultures contain similar amount of bacteria to measure the mutation frequency (but we expect that two of them the numbers must be higher, aren´t they?). In order to estimate such number we prepare plates of TY media containing Kanamycin as antibiotic and also with and without 5% of Sacarose.  Following a rule of serial dilutions:


2- Serial dilutions performed
We get three groups of plates corresponding with every single culture (1-3). And from the culture 3 we get a “duplo” of plates incubated in the Lab (our control).
c)       In 6-7 days (maybe less) we expect to have the data of single colonies to count (four data to get the mutant frequency). In order to understand what we are performing we can follow all the entries of the previous blog: http://dondemutanlosgenes.blogspot.com.es/.
Going from the first entries: Nov 2014 untill the end.
Our methodology is similar… .
But, what is different, what is new?
We performed yesterday our first uv shock test in order to “calibrate” the uv pressure for next experiments.
In resources you have a manuscript describing the recA mutant in S. meliloti bacteria (article link). We must understand that a bacteria with this gene mutated is more sensitive to uv treatment than the wild type (see figure 6A of the article).


3-Effect of uv treatment on RecA mutant bacterial cells
Then, we compare in our hands this test by spreading a continuous lawn of bacteria (wt and RecA mutant) on plates and defining a time course from 10’, 5’,2’,1’, 30’’,10’’ and 5’’ of uv treatment.

 4-Preparing the plate for time course of uv treatment

 1-video: how the bacterial extension was made.

 5- uv shock
Again, a “duplo” was made and one of the plates is at Paula’s home meanwhile the other is in the Lab. We have to decide which is the range of the uv shock to perform our mutagenesis experiments.
Be aware (mails, blogs and wassaps) of our first results of this fantastic project!!!
And Merry Chirstmas !!

Francisco Martínez-Abarca
Departamento de Microbiología y Sistemas Simbióticos.
Estación Experimental del Zaidín. CSIC.
Granada 

Thursday, 3 December 2015

Drawing our first conclussions

Hi Team:
Here you are the timecourse of the bacterial growing plates in 6 of the 7 houses. Alba’s house we have no data. However we can conclude an order of optimal house growing for the next experiments. 


Please!! We must decide which is the best(s) house to make all the experiments together. Several data we have to take in mind for this decission.
- Compare the growth with the lab control.
- How nice are the picture made?
I am expecting your conclusions (please use the blog for them // in Spanish or English).
Next session we have to take this conclusion in mind!!!.
Come on, the project looks nice!!!

Dr Francisco Martinez-Abarca
Department of Microbiology
C/ Profesor Albareda n 1
18008 Granada
Spain