Tuesday 26 January 2016

When some experiments are a mess


Sometimes in Science the data you expect from your experiments do not appear. This is the reason why Biology, or Microbiology in this case, is an experimental Science. As you already know last experiments should have indicated a putative mutation frequency affected by the uv treatment. However, we have only data from the plates incubated at Paula’s Home (Fig. 1; 3I plates). The plates incubated in the Lab (3G plates) are a real mess!


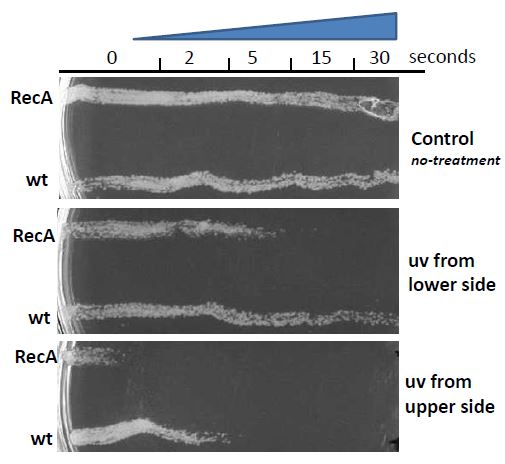
Figure 1: images of the plates with identical dilutions of 3I (Paula’splates) and 3G (Labplates)isolates. Above plates indicating total bacteria (TY plates). Below plates indicating mutants in SacB gene (Sacarose plates). In 3G plates the bacterial spread was not properly done. Plates were not dried before to perform incubations.It is difficult to count colonies and to be sure of the dilutions performed.

Which is this difference of this result with the previous one (see last entries)?
 As I mention, something (just a Little detail) was wrong. I found out that the plate were humid when I saw one day later after incubation. This humidity is critical to form single colonies (also occur in previous experiments). Does it!!!.
However, in spite we can not yet estimate the mutant frequency. We can deduce that the experiments are, in principle,well performed. Uv treatments looks to have in effect on bacteria, and the dilutions calculated are probably right in order to get the accurate conclussions of our work.
Come onstudents!!
We have to planify the next experiments in order to avoid this error. Plates must be dry by standing opened for a while (3-5 min) before to close with parafilm and put in the incubators.
Again, next session is awaiting us!!
That is Science!! Be patients and consistents.

Francisco Martínez-Abarca
Estación Experimental del Zaidín. CSIC.
Granada 

Tuesday 19 January 2016

The beginning of our experimental work end

Hi All:
As usual, how hard was our last session! Wasn´t it!!

Figure 1:Lucia and Mónica starting their bacterial dilution series.

Why was it so hard?
Because…
First of all, we were discussing during almost two hours what we performed until 18th of January of 2016 in our Project: Studying uv effect on bacterial growth… .Since the first experiment: how many bacteria are in a single colony?  To the final one: determine which is our basal mutation frequency.
Second: We discussed what the number of colonies in the plates means. And as a consequence we ‘ve found out what we are doing with
-Dilutions of cultures,
-plating,
-volumes…
And as I mention previously, we are counting bacterial colonies!!!.

 Figure 2: Cristina and Alba counting…

We estimated the división rate of our bacteria at… Paula’s home and Laboratory (28ºC) conditions.
Remember:
2n = Nº of Total bacteria; then, n is… (see your notebooks!!!).
And we also performed the following table:


Table 1: Colonies number to determine the mutation frequency (dilutions 0 and -1 corresponds to number of colonies in Sacarose 5% plates; dilutions -5 and -6 with TY plates).

And confirm we are in agreement with previous results in last PIIISA Project (see here
And Finally we planify our first uv treatment experiment!!!.
Based on literature and what we expected we performed the following experiment:
Two bacteria (3I, series 1-3;  and 3G, series 4-6).
Three uv stress conditions: 0 (no stress), 15 and 30 seconds.
In order to get all the numbering data we decided to make the corresponding dilutions of the following manner:     
a)  For the Control plates (0 uv treatment; series plates 1 and 4). The dilutions were performed in a similar way to previous one.

b) For the 15 and 30 s uv treatment (series 2-3 and 5-6). We estimated that 90-99% of the bacteria will dead. Then the dilutions performed were: 
  

After several rounds of dilutions, spreading (hopefully) without mistakes, we are waiting for our results. We have two different strains (3G and 3I) to have any data. One (3I) it is incubated at Paula’s home

 Fig. 3: OurPaula’s home incubator.

And the second (3G) in the Lab.
Several critical points in our experiment:
1)      Did we make the calculations properly?? (I think so but… who knows?)
2)      Did we make the dilutions properly?? Everybody should peform the pipetting and tubes and plates properly, without any mistake. (We’ll see….).
3)      The most important one: Is it adecuate the uv treatment performed??  This is, neither great, so we kill too many cells, nor small we didn’t see any mutation rate increase.

Girls, Keep alert!!

Next results will define how far we are in our Project.
Come on!!! we are closer to the End

Francisco Martínez-Abarca
Estación Experimental del Zaidín. CSIC.
Granada

Thursday 14 January 2016

Ready for our next session

Hi  All:
The next session (first session of 2016) is awaiting us. Finally we have data about the uv treatment we are going to made (see previous entries and Figure 1).


Figure 1: Time course of uv treatment of wt and RecA mutant (uv sensitive) S. meliloti spread on plates. After uv doses (0-30 s) TY rich media plates were incubated for 4 days at 28ºC.


As expert in Microbiology you are able to understand completely this result, aren’t you? 
With this result, we have enough data to determine our uv treatment in order to test our hypothesis. Next session we'll discuss the results of previous experiments (colony counting and estimation of mutation frequency; 17th December entry) and interpretation of this last result. 
Come on!!! Hopefully, we are finishing our experimental research and starting to get and interpret our results.

For next session do not forget:
-Calculators
-Your notebooks
-Remember all we have made until now
And have your minds wide awake!!!

Francisco Martínez-Abarca
Estación Experimental del Zaidín. CSIC.
Granada